


Essay example for IELTS;
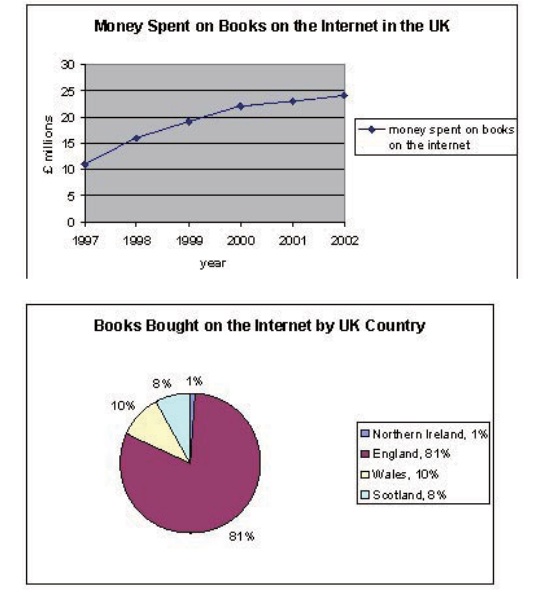
First chart represent expenditure for buying books over the internet distribution by years. United Kingdom inhabitants spent money in total approximately 115 millions pound between 1997 and 2002. In particular, outlay on books moved up quickly from over 10 millions pounds to 22 millions ponds in the first four years. Following years increased gradually and reached a peak of 24 millions pound in 2012.
The pie chart compares the proportion of books bought on the Internet some countries in United Kingdom. Respectively, people from England percentage was 81% did highest, in the second place comes Wales folks with a percentage of 10%, third place was Scotland people with 8% and last place was Northern Ireland inhabitants just 1%. England people have percentage almost four times bigger than other countries. In addition to this, overall Scotland and Northern Ireland’s percentages of people were lower than Wales folks.


Yorumlar
thank you